


Self Potential (SP)
2.3. Self Potential (SP)#
The purpose of this repository is to reconstruct paper from Y. Kim and N. Nakata (The Leading Edge, Volume 37, Issue 12, Dec 2018) about Geophysical inversion versus machine learning in inverse problems and B. Russel (The Leading Edge, Volume 38, Issue 7, Jul 2019) about Machine learning and geophysical inversion — A numerical study.
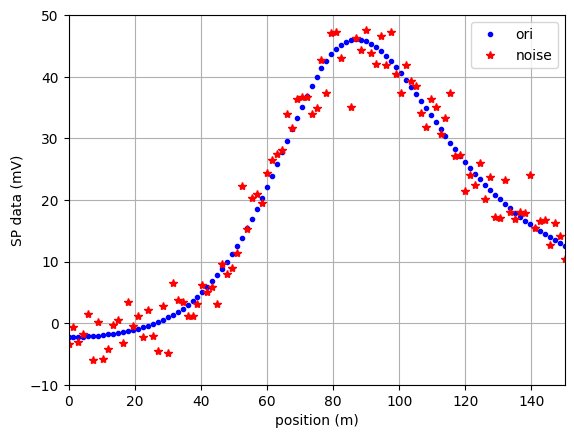
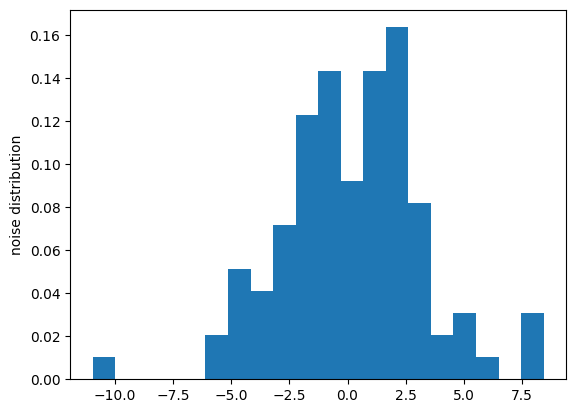
Reference: Inversion of Self Potential Anomalies with Multilayer Perceptron Neural Networks Ilknur Kaftan et. al, 2014, Pure Appl. Geophys Syntethic data was created from sphere model (using fwd_sp.py) with parameters K = 94,686, h = 41.81 m, alpha = 309.37, dan x0 = 77.07 m. This result can be downloaded here and seen below with noise distribution.
import numpy as np
import matplotlib.pyplot as plt
import pickle
forward modeling function
# SP forward function
def SPfunc(x_inp, par):
    var_x0 = par[0]
    var_alpha = par[1]
    var_h = par[2]
    var_k = par[3]

    var_sp = []
    for i in x_inp:
        var_up = (i - var_x0) * np.cos(var_alpha) - var_h * np.sin(var_alpha)
        var_down = ((i - var_x0)*(i - var_x0) + var_h*var_h) ** (3/2)
        var = var_k * (var_up / var_down)
        var_sp.append(var)

    # === give noise for data (Gaussian Noise) 1
    std_noise = 10  # = %
    mean_noise = 0
    noise_data = np.random.normal(mean_noise, np.sqrt(std_noise), len(var_sp))
    var_sp_noise = var_sp + noise_data

    return var_sp, var_sp_noise, noise_data
# === TEST FORWARD MODELING
x0 = 77.07  # m
alpha = 309.37 * (np.pi/180)    # deg2rad
h = 41.81   # m
K = 94686
Calculating data
measure_loc = np.linspace(0, 150, 101)  # Location of measurement
print('number of data: ', len(measure_loc))
par_mod = [x0, alpha, h, K]      # model parameter of subsurface

get_SPData, get_SPData_noise, noise_from_maxData = SPfunc(measure_loc, par_mod)   # forward modeling test
number of data: 101
Plotting
plt.figure()
plt.plot(measure_loc, get_SPData, 'b.')
plt.plot(measure_loc, get_SPData_noise, 'r*')
plt.xlim([0, 150])
plt.ylim([-10, 50])
plt.xlabel('position (m)')
plt.ylabel('SP data (mV)')
plt.legend(['ori', 'noise'])
plt.grid()

plt.figure()
plt.hist(noise_from_maxData, density=True, bins=20)
plt.ylabel('noise distribution')
plt.show()
Save output
with open('SP_syn_data.pickle', 'wb') as f:
    pickle.dump([measure_loc, get_SPData_noise], f)